Zabbix Server
Learn what Zabbix is, its features, and common use cases.
Overview of Zabbix Server
The Zabbix Server is the central component of the Zabbix monitoring solution. It collects, processes, and analyzes data from various devices and services across your infrastructure. With Zabbix Server, you can monitor performance, availability, and receive alerts for potential issues, helping you ensure the reliability and stability of your systems.
Adding New Hosts
To add new hosts in Zabbix, go to the Configuration section and select Hosts. Click Create host to open the page where you can add a new host. Here is what the blank "Create host" page looks like:

On this page, specify the Host Name / IP address, and assign it to the appropriate group. To enable monitoring, you need to add an interface. Zabbix supports several types :
Agent: For servers with the Zabbix agent. Provides system metrics.SNMP: For network devices. Standard for network monitoring.JMX: For Java applications.IPMI: For hardware-level monitoring.
Select the interface type that fits your device, enter the IP address and port, and assign the host to a group. You can also link templates for automatic item and trigger creation. Once saved, Zabbix will start monitoring the host based on your settings.
Creating New Triggers
Triggers in Zabbix are used to define conditions that indicate potential problems or anomalies in your monitored environment. A trigger evaluates the data collected from items and generates alerts when certain thresholds or patterns are met.
To create a new trigger :
- Navigate to the
Configurationsection and selectHosts. - Choose the host for which you want to create a trigger.
- Go to the
Triggerstab and clickCreate trigger.
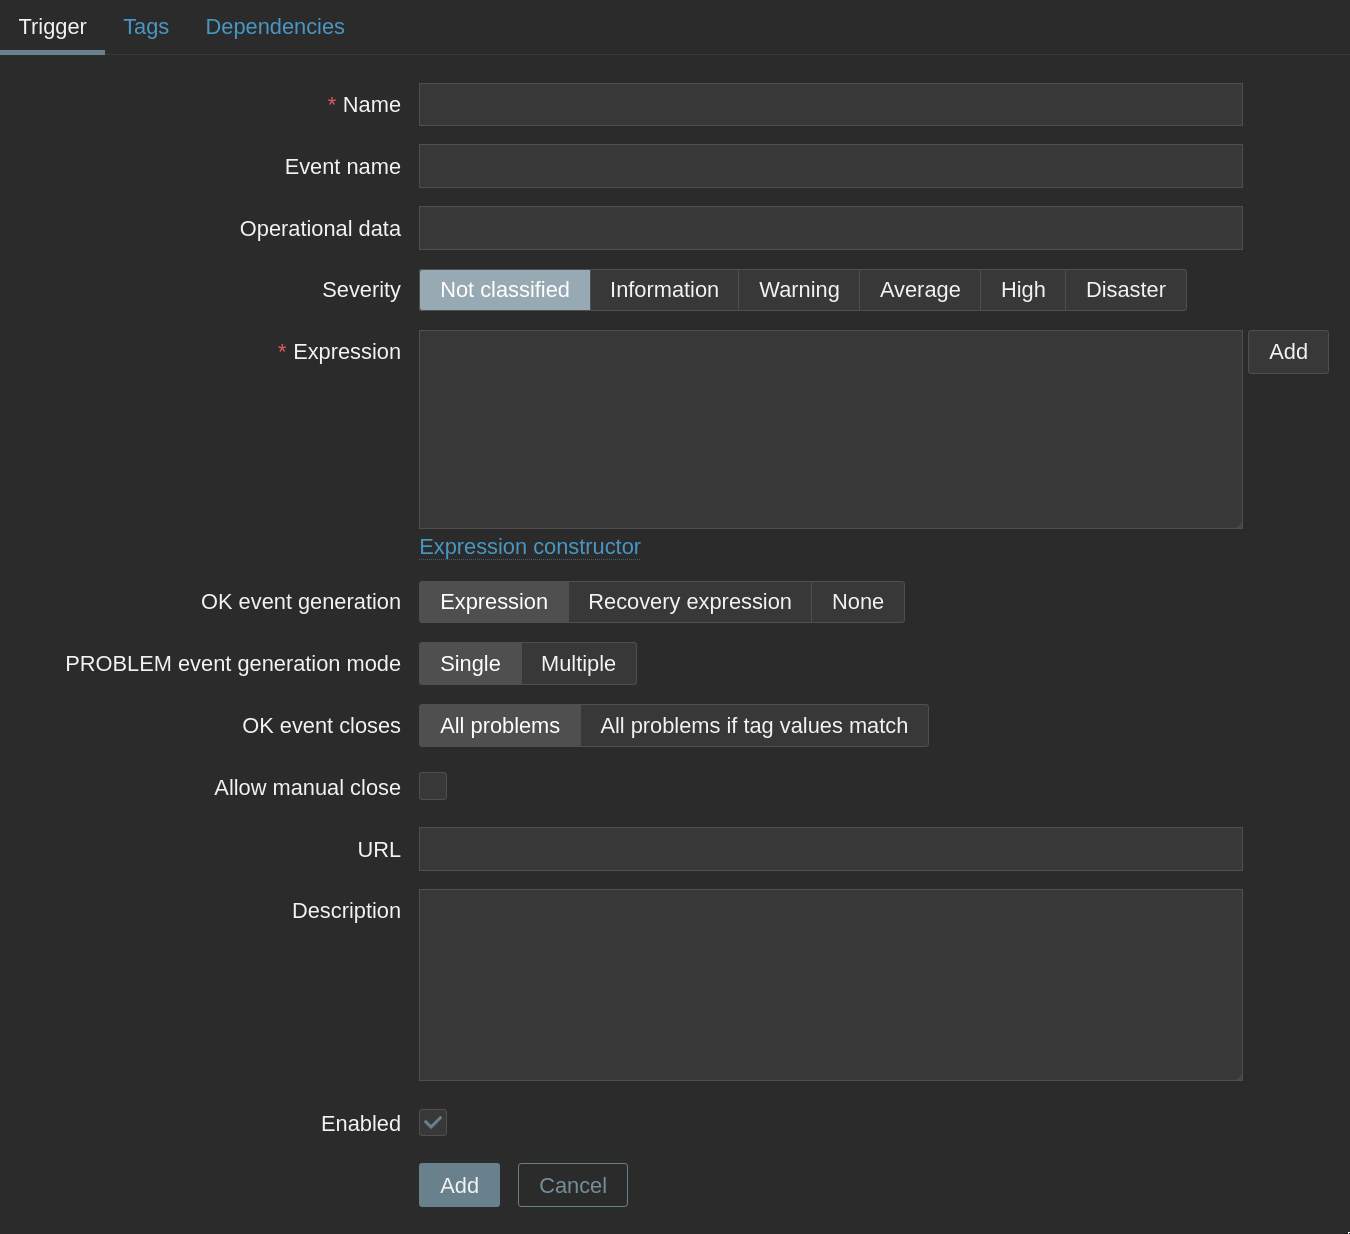
On the trigger creation page, you can :
Name your trigger: Use a descriptive name that clearly states the condition.Set the expression: Use the expression constructor to easily build trigger conditions without manual coding. Select items and logic visually for quick, error-free setup.Assign severity: Choose the appropriate severity level (Information, Warning, Average, High, Disaster).Add dependencies: Link triggers to avoid duplicate alerts for related issues.
Once configured, save your trigger. Zabbix will now automatically evaluate the condition and notify you if it is met, helping you respond quickly to issues in your infrastructure.
Adding New Items
Items in Zabbix are the individual metrics or data points you want to monitor on your hosts. Examples include CPU usage, memory consumption, disk space, network traffic, and more.
To add a new item :
- Go to the
Configurationsection and selectHosts. - Choose the host you want to add an item to.
- Click on the
Itemstab and thenCreate item.
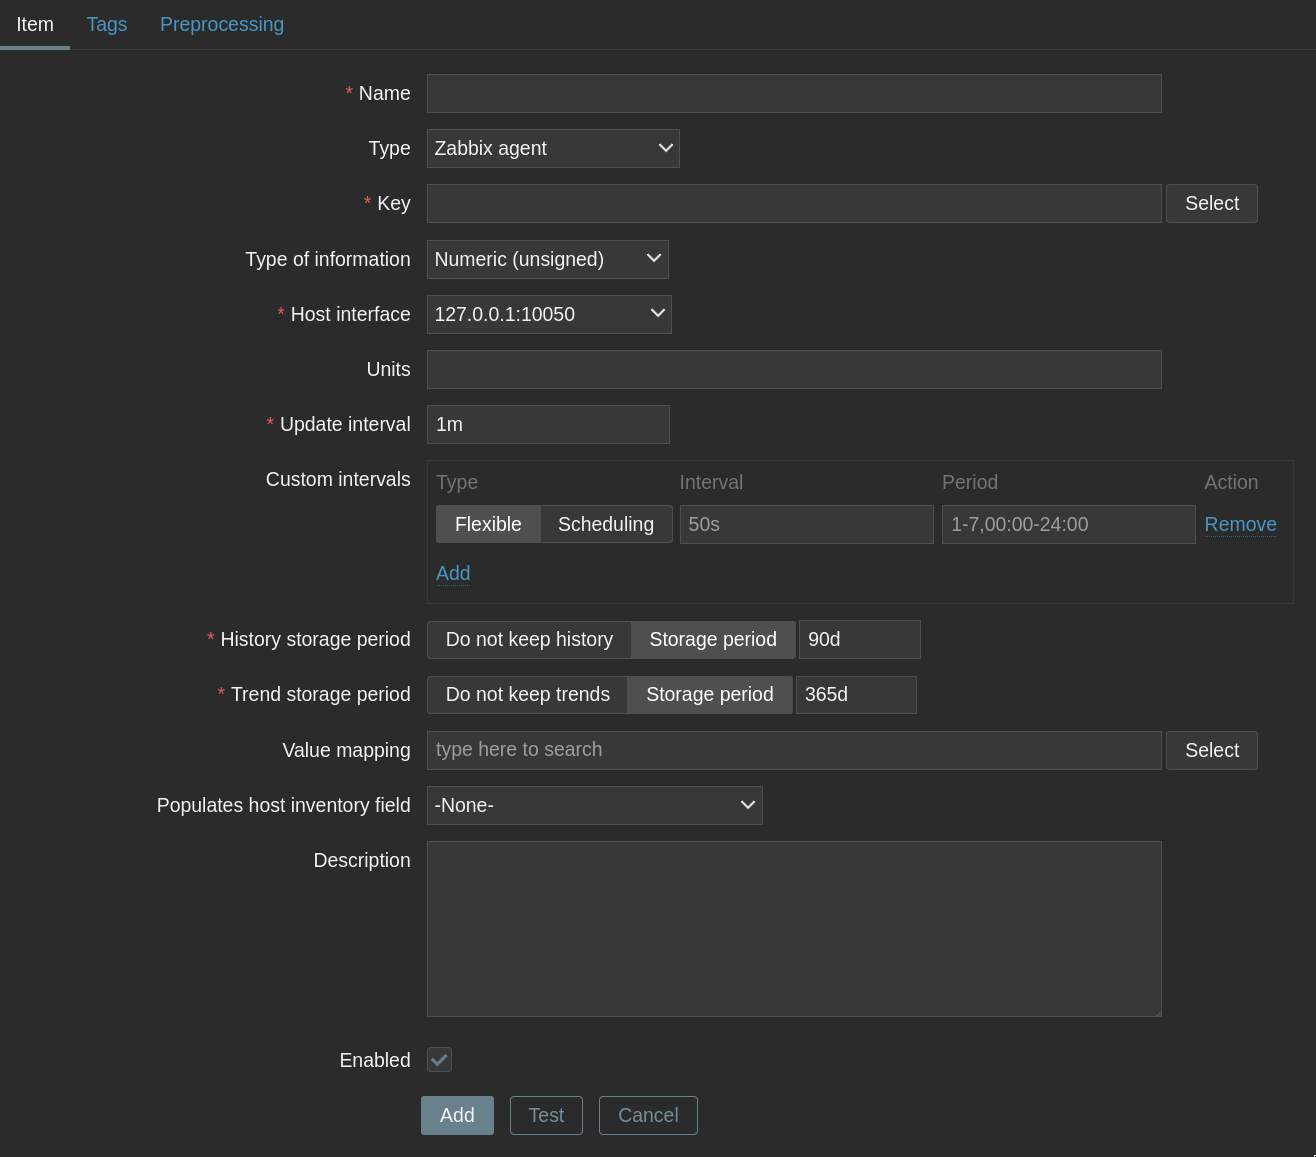
On the item creation page, you can :
Name your item: Use a clear, descriptive name for easy identification.Select the type: Choose how Zabbix will collect the data (e.g., Zabbix agent, SNMP, JMX, etc.).Set the key: Define the specific metric or parameter to monitor.Configure update interval: Decide how often Zabbix should check this item.Set history and trends: Specify how long to keep detailed and summarized data.
After saving, Zabbix will start collecting data for the new item, allowing you to track and analyze it in your dashboards and reports.
Creating New Templates
Templates in Zabbix are reusable sets of items, triggers, graphs, and other monitoring entities that you can link to multiple hosts. Using templates makes it easy to apply consistent monitoring rules across similar devices or services.
To create a new template :
- Go to the
Configurationsection and selectTemplates. - Click
Create templateto open the template creation page. - Enter a name and assign the template to a group.
- Add items, triggers, graphs, and applications as needed.
Once your template is configured, you can link it to any host. This allows you to quickly deploy standardized monitoring setups and maintain them efficiently across your infrastructure.